FinGraphs Markets in 3D
FinGraphs' was inspired by Dow's second basic principle : the market has three trends - primary, secondary & minor. This is why FinGraphs' presentations (or Views) of the market is over 3 time dimensions 1 2 3. These notions of views are described in the following tabs.
1 The "main movement", primary movement or major trend.

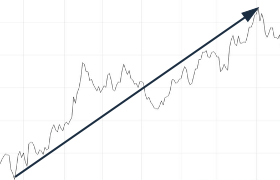
The primary trend is the main trend. If this trend is rising, then it is considered bullish, elsewise the trend is considered failling or bearish.
2 The "medium term swing", secondary or intermediate movement.

This intermediate trend is found within the primary i.e. a new impulse within a correction against the primary trend.
3 The "short term swing", minor movement is found within the secondary.

The minor trend is either a new impulse within or a corrective move against the secondary trend.


3D Views
Knowing your time horizon is extremely important when it comes to choosing the type of investments decisions you want to make. There is no "right" time Frame, it depends on each investor's or trader's individual objectives.

Chart Summary

Trends Identification

POTENTIAL TRENDS UP OR DOWN BASED ON THE DIRECTION OF FINGRAPHS' ENVELOPES
Target Estimates

POSSIBLE PRICE
TARGET ZONES
CORRECTIVE UP OR DOWN
IMPULSIVE UP
IMPULSIVE DOWN
Price Exaggeration

IDENTIFY PRICE EXAGGERATIONS
WHEN BOTH FINGRAPHS' ENVELOPES TOUCH EACH OTHER
Risk Indicator

MONITOR
OVERBOUGHT / OVERSOLD
CONDITIONS
USING FINGRAPHS'
RISK INDEX
